Afghanistan's
Multi-Hazard
Intelligence Platform
50 climate, drought, flood, and hazard indices — national, provincial, and district scale. Satellite data from 1950 to the present. Built for humanitarian practitioners, DRR specialists, and climate finance teams.
50
400+
1950
DATA FROM
INDICES
DISDRICTS
About the Platform
Built for Afghanistan's
most critical data gaps
Where rain gauge networks are sparse, ground stations are absent, and field surveys are impossible — satellite intelligence fills the gap. Chashma-Sar provides free, authoritative, actionable data at national scale.
50 Indices · 7 Categories
Where rain gauge networks are sparse, ground stations are absent, and field surveys are impossible — satellite intelligence fills the gap. Chashma-Sar provides free, authoritative, actionable data at national scale.
National · Provincial · District
Smart Date Presets
Optimised for 256 kbps
National overviews, 34-province zonal statistics, and 400+ district-level analysis. Export PNG maps, CSV tables, and GeoTIFF rasters for ArcGIS/QGIS.
Every index shows 4 tailored date presets anchored to its dataset's confirmed coverage — preventing empty-map errors on slow connections without any guesswork.
Province and district selection reduces tile loading 4–12×. Two-phase loading banner keeps users informed. Works on any modern browser — no installation.
Chashma-Sar Consulting Co.
Platform developer and technical lead. Specialises in water resources, DRR, and satellite intelligence for Central Asia.
MSSADO
Google Earth Engine
Sayed Abdul Baset Rahmani, M.Sc.
Cloud computing infrastructure. Enables planetary-scale satellite analysis without local hardware. Comparable capability to SERVIR / NASA FIRMS.
Platform Director. Water Resources & DRR Specialist. Published researcher (ACS ES&T Water Q1, 2024). GEE-certified practitioner.
Implementation partner. Afghan civil society organisation working on sustainable development, water, and DRR across 34 provinces.
→ b.rahmani@chashma-sar.com
Index Reference
50 indices · 7 categories
Two types of layer: dynamic indices update with your date selection; static terrain layers are fixed and do not change with dates.
Data coverage: Most indices (MODIS-based) cover 2000–present. CHIRPS precipitation: 1981–present. ERA5-Land (temperature, ColdSpell, RSPI): 1950–present. FLDAS soil moisture: 1982–Jan 2024. GRACE groundwater: 2002–Sep 2024. TerraClimate PDSI: 1958–Dec 2023.
Changes with date selection
Fixed terrain — date does not apply
🌾 Agricultural Drought
VHI below 40 = moderate drought; below 20 = extreme. AVI (Agricultural Vulnerability Index) combines NDVI anomaly, SPI, WSI, LST anomaly, and soil moisture — designed for food security targeting.
SeasonalFcst (GFS): 16-day precipitation forecast, best accuracy Days 1–7. ERA5 reanalysis: 1950–present, ~11 km — the only dataset covering 75 years. Ideal for long-term trend analysis and GCF/GEF evidence packages.
AHP composites combine 3–5 satellite datasets with peer-reviewed weights to produce 0–100 risk scores. FloodRiverAHP uses MERIT Hydro river proximity — includes all rivers (Helmand, Kabul, Arghandab). Use Quick Date presets to ensure all components have data.
MNDWI = near-real-time flood extent (MODIS, 500 m). Static terrain layers are proxy indices for relative risk planning — not certified hazard maps. Date selection does not affect static layers.
PET now uses ERA5-Land — covers all land surfaces including arid desert. ARI (Sentinel-5P): negative = clean air, positive = absorbing aerosol/dust. PDSI data ends December 2023.
PSC and SWE include elevation mask (500m+) to remove false snow signals from Sistan Basin salt flats. GWS_Anom (GRACE) shows groundwater trends at ~300 km resolution — regional use only.
CHIRPS-based precipitation (1981–present). ERA5-Land temperature indices. SPI-3 < −2.0 = extreme drought. HeatIdx > 40°C = human health hazard — best used for summer months (Jun–Aug).
🌧 Meteorological Drought
📡 Forecast & Reanalysis
📊 Multi-Hazard Composites (AHP)
⚡ Physical Hazards
🌡 Climate Change Indicators
💧 Hydrological Drought
New Feature
📅 Smart Date Presets
Every index now shows 4 tailored date preset buttons in the Region tab. They update automatically when you switch indices — anchored to each dataset's last confirmed available date, so users on slow connections never get empty-map errors.
MODIS ends late 2025 · CHIRPS ends Feb 2026 · FLDAS ends Jan 2024 · GRACE ends Sep 2024 · TerraClimate ends Dec 2023 · JRC ends Jan 2022
Dataset-aware anchoring
📊
Designed for Afghan users
One-click date setting
⚡
Click any preset → start and end dates update instantly → click Show on Map — no manual date entry required
🌍
Click any preset → start and end dates update instantly → click Show on Map — no manual date entry required
Example — NDVI selected
START DATE
2025-11-01
END DATE
2025-11-30
Compare vs PDSI (TerraClimate): presets automatically shift to 1 year · 3 years · 5 years · 20 years — anchored to the 2023-12 end date. GWS_Anom shifts to 3 months · 1 year · 3 years · 5 years anchored to Sep 2024.
How to Use
Four steps to your first map
No account required. No installation. Works on any browser including Chrome on Android and Safari on iPhone.
1
2
4
3
Open the Platform
Select an Index
Show on Map
Export & Analyse
Click Launch Platform above or visit the URL. The platform loads directly — no login, no installation, no Google account needed.
Generate time series charts, compute province rankings, download PNG maps, copy CSV to Excel, or export GeoTIFF for ArcGIS/QGIS.
Click "Show on Map". Phase 1 (amber) = server computing. Phase 2 (blue) = tiles streaming to your browser. On 256 kbps: 1–2 min for country, 20 sec for province.
Use the search bar (type 'vhi', 'flood', 'spi') or browse by category. Switch to the Region tab and click a Quick Date preset button.
Professional Services
The platform is Open Access.
Our expertise is not.
Chashma-Sar is Open access and explore. Structured analysis, custom deliverables, and professional engagements — designed for INGOs, UN agencies, development banks, and companies — require a service contract.
Province-level drought, flood, or multi-hazard situation reports. VHI, SPI, WSDI province rankings with maps and trend charts. Ready for cluster submissions or donor briefs.
Dataset-aware anchoring
📊
INGOs · UN agencies · Development banks · Companies · Climate finance teams Contact: · Response: 2–5 working days
INGOs · UN · OCHA
🌡
PDSI 20-year trend, groundwater depletion, desertification index, temperature time series — packaged as the "Climate Baseline" chapter for GCF, GEF, or LDCF proposals.
Index threshold design, alert logic, and integration with existing EWS workflows. MHDC province prioritisation for pre-positioning response. Protocol documentation included.
Bulk exports of any index for any province, district, or custom polygon. Delivered as GeoTIFF for ArcGIS/QGIS or CSV tables for Excel. Annual or multi-year time series available.
Drought, flood, and climate risk assessment for project sites or investment portfolios in Afghanistan. Suitable for ESRS, IFC Performance Standards, and ESG screening frameworks.
Co-authorship on Afghanistan climate studies. Platform co-citation. Published researcher (ACS ES&T Water, Q1, 2024). National Hazard Atlas of Afghanistan (2020) co-author.
🔬
📑
🗺
⚠️
Research Collaboration
Environmental Risk Assessment
GeoTIFF & GIS Data Packages
Early Warning System Design
Climate Finance Baselines
Universities · Research institutions
Banks · Private sector · IFC
Companies · Engineering · Banks
UN · Government · ANDMA
GCF · GEF · LDCF · ADB · WB
Contact for pricing
Contact for pricing
Contact for pricing
Contact for pricing
Contact for pricing
Contact for pricing
User Manual
Platform documentation
Where rain gauge networks are sparse, ground stations are absent, and field surveys are impossible — satellite intelligence fills the gap. Chashma-Sar provides free, authoritative, actionable data at national scale.
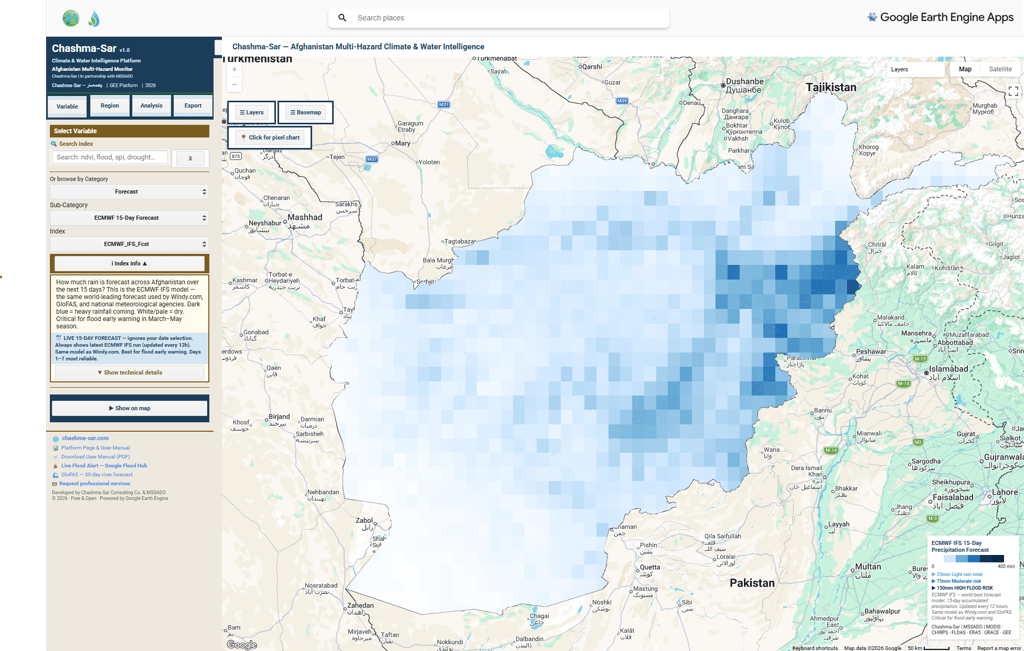
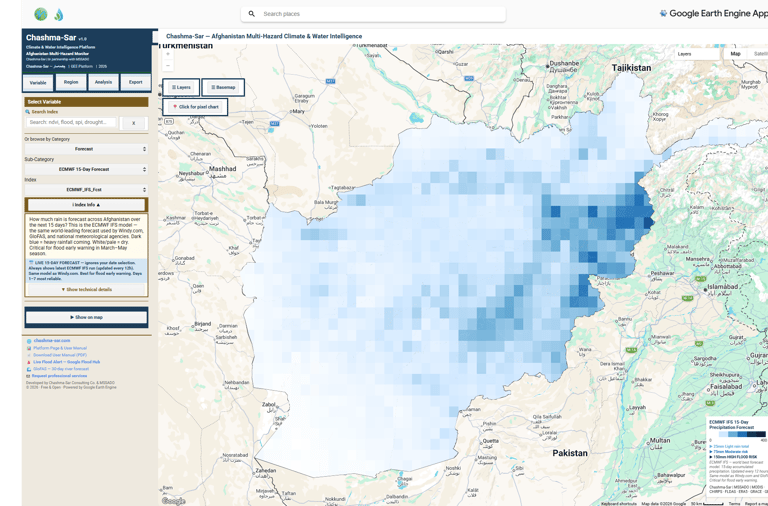
Interface Overview
Four tabs · Search bar · Map toolbar · Two-phase loading banner · Quick Date Presets · About & Links footer
CHAPTER 1
CHAPTER 6 + Appendices
CHAPTER 5
CHAPTER 4
CHAPTER 3
CHAPTER 2
Troubleshooting & Reference
Use Case Guides
Exporting Data
Charts & Analysis
Index Reference (50 Indices)
8 FAQ entries · Data availability table · Dataset limitations · Citation · Contact · Glossary (40+ terms)
Food security & drought reports (WFP/FAO/OCHA) · Flood early warning · DRR priority assessment · GCF/GEF climate finance evidence
PNG map images · CSV to Excel (step-by-step) · GeoTIFF for ArcGIS / QGIS
Time series charts · Pixel charts · Province ranking · District statistics · Split view year comparison
All 7 categories · Dynamic vs static · Sub-category descriptions · Data sources and coverage limits
Open the Platform Now
Professional Registration Required for Access
Chashma-Sar · MSSADO · 2026
© 2026 Chashma-Sar Consulting Co. · MSSADO · All rights reserved